Get Smart! Use SmartArt.
Tired of writing boring reports crammed with solemn columns of facts and figures? Why not add some visual interest to your document by using SmartArt? SmartArt is a fun and clever feature that allows you to display your information in a visual format. This pictorial depiction of data can liven up even the most boring report. By means of visual representation, SmartArt displays the data in your document with diagrams of interconnected shapes. And, though there are a variety of different SmartArt graphics available, they are similar in the way they work.

Consider your content and then choose the SmartArt layout that conveys your message most effectively. For instance, if you want to display non-sequential information, choose the layout from the List category; whereas, if your information consists of a decision tree or an organization chart, then use the Hierarchy category.
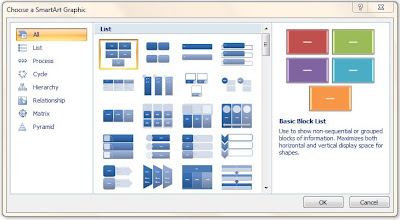
 You can access SmartArt graphics in Word, Excel or PowerPoint. Regardless of whether you are using Word, Excel or PowerPoint, here’s how you can access SmartArt: From the Insert tab, in the Illustrations group, click on SmartArt. The SmartArt dialog box will open for you to choose the type of diagram you want to insert into your document. Click on the image you want and then click OK. The SmartArt graphic of your choice will be inserted into your document.
 You can add text to your SmartArt graphic in two ways:
 In order to add more shapes to your SmartArt graphic, or change the color and design of your Smart Art graphic, make sure to click on your SmartArt first.
You can add more shapes to your SmartArt graphic from the Design tab, under SmartArt Tools, in the Create Graphic group. Click the arrow under Add Shape.
You can change the color of your SmartArt graphic or add Shape Effects to SmartArt by using the tools in the Design and Format tabs under SmartArt Tools.

To delete a shape from your SmartArt graphic, click the shape you want to delete, and then press the Delete key on your keyboard. To delete your entire SmartArt graphic, click the border or outline of your SmartArt graphic, and then use the Delete key on your keyboard.
So go ahead use SmartArt and add pizzazz to your document as you insert simple Lists and Process diagrams or insert complex Venn diagrams and organization charts.

Consider your content and then choose the SmartArt layout that conveys your message most effectively. For instance, if you want to display non-sequential information, choose the layout from the List category; whereas, if your information consists of a decision tree or an organization chart, then use the Hierarchy category.
 You can access SmartArt graphics in Word, Excel or PowerPoint. Regardless of whether you are using Word, Excel or PowerPoint, here’s how you can access SmartArt: From the Insert tab, in the Illustrations group, click on SmartArt. The SmartArt dialog box will open for you to choose the type of diagram you want to insert into your document. Click on the image you want and then click OK. The SmartArt graphic of your choice will be inserted into your document.
 You can add text to your SmartArt graphic in two ways:
- Click in a box in the SmartArt graphic, and type your text directly into the text box; or
- Once you have inserted a SmartArt graphic, click the arrows on the left of the SmartArt graphic. This will open up the Text Pane where you can proceed to type in text.
 In order to add more shapes to your SmartArt graphic, or change the color and design of your Smart Art graphic, make sure to click on your SmartArt first.
You can add more shapes to your SmartArt graphic from the Design tab, under SmartArt Tools, in the Create Graphic group. Click the arrow under Add Shape.
You can change the color of your SmartArt graphic or add Shape Effects to SmartArt by using the tools in the Design and Format tabs under SmartArt Tools.

To delete a shape from your SmartArt graphic, click the shape you want to delete, and then press the Delete key on your keyboard. To delete your entire SmartArt graphic, click the border or outline of your SmartArt graphic, and then use the Delete key on your keyboard.
So go ahead use SmartArt and add pizzazz to your document as you insert simple Lists and Process diagrams or insert complex Venn diagrams and organization charts.
- Rina B.
Comments
Post a Comment