Condition Your Rows!
Are you going cross-eyed squinting over tables of data in your Excel worksheet? Do your colleagues dread having to look at your monthly attachments containing large Excel sheets with loads of data tables that have to be read and analyzed? Why not make your Excel document easy on the eye by coloring every other row a different color? Not only will this trick make your Excel document more readable but it will also add an “eye-candy” appeal! Adding a different color to even/odd number of rows is easy to do by using Conditional Formatting and writing a simple formula. Not only can you make your table look pretty but it will also make it much more readable. Here’s how:
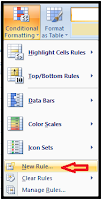
After you have completed your table, select the entire table. [If it is a large table, simply use ctrl+a to select the entire worksheet]. From the Home tab, in the Styles group, click on Conditional Formatting. From the drop-down menu that will appear, choose New Rule.
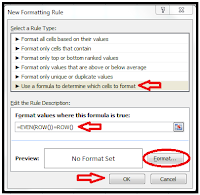
From the New Formatting Rule box, under Select a Rule Type, click on Use a formula to determine which cells to format. In the category Edit the Rule Description, under Format values where this formula is true, type this formula =EVEN(ROW())=ROW(). Click on Format. From the Format Cells dialog box click on the Fill tab.

Then simply choose the color or the Fill Effects you want and click OK and the click OK again. Lo and behold! All the even numbered rows in your table will now have the formatted color of your choice.

To color the odd numbered rows in your table, repeat all the steps except when it comes time to write the formula. Replace the word EVEN with ODD. So the formula should now read thus:
= ODD(ROW())=ROW().
- Formulas in Excel are not case sensitive so capitalization is not necessary.
- If you add more rows to your table, conditional formatting is automatically copied to the newly added rows.
- If you wanted to color alternate columns, then just replace the word ROW with COLUMN when you type the formula.
- Be careful when selecting the colors for your rows – too much fill effects or conflicting colors can lead to your table looking rather ugly and headache-inducing!
- Rina B.
Since you are doing this in Office 2007 - wouldn't it be easier to use the Format as Table command? Tables give you styles that automatically format banded rows (and columns too!) You could always convert the table back to range if you didn't want it to be a table anymore. But tables will automatically let you add on rows - without the trouble of having to do a conditional format rule with a formula.
ReplyDeleteYou're right Rob. Tables are an easy way to format without having to write a formula, but when people use the Format as Tables feature to format, they also get the added Sort function tabs, which they may not want. I am going to write about Format as Table feature in a future blog so that I can also write about the added functionality.
ReplyDelete