Use Format as Table in Excel 2007 for Easier Data Analysis!
Tables are an easy way to add color to your rows and columns in Excel 2007. As some of you have already discovered, you don’t have to use Conditional Formatting to make your tables easy to read and look pretty. You can use the Format as Table command and add color to your tables. But there are also multiple benefits of added functionality when you use the Format as Table feature:

The header row will remain visible as you scroll.
If you have a large table, Format as Table keeps the header row locked, so your labels stay visible as you scroll through the table.
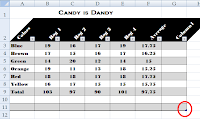
Easily expand your table.
The corner handle on the bottom right-hand corner of the table allows you to easily add more rows or columns and the format will match your existing table design.
Effortlessly select your data.
You can select the entire data area of your table by putting your cursor near the top left corner until it changes into a bold southward pointing arrow and dragging the arrow; or you can select just the data in column one by putting your cursor on the line between row 1 and 2. It will change into a bold downward arrow and clicking on it will select the entire column area that contains your data.


You can Filter and Sort the data in your table using the tabs.
Now you can use the drop-down tabs and access a menu where you can use Number Filters, sort your data from smallest to largest or vice versa; click on Sort by Color and open a dialog box offering custom sort with three criteria.


Table Tools and the Design tab.
Once you use the Format as Table feature you will also see the Design tab appear when you click on your table. The Design tab, under Table Tools offers various extra features to help you customize your table. You can change the name of the table and resize it from the Properties group in the Design tab; from the Tools group you can Summarize with Pivot Table, Remove Duplicates, and Convert to Range. From the Table Styles Options group you can decide how the table styles are to be applied to your table, whether you want a Header row and a Total Row, or if you want the first or the last column to be formatted differently. You can also quickly change the style of your table from the Table Styles group and preview an existing style from the gallery of styles or create your own table style. From the Design tab, you can also Clear all the formatting while keeping your data intact.

In order to use Format as Table, the first thing you have to do is, of course, enter your data. Then select/highlight the table. Do not select the title row.
Then from the Home tab, in the Styles group, click on Format as Table. From the gallery of table styles, click the one you like. Once you select a table style, the gallery of pre-designed formats will close and you will see a dialog box confirming the range of cells you want to format as a table. If your table contains a header row, with labels, make sure the checkbox in front of My table has headers is checked. Click OK to format your data as a table and you will see your table not only look pretty but you will also see the tabs that offer added functionality. You will also see the contextual Design tab with more customizing options.

So you see, Format as Table feature does much more than just add color to your columns and rows. It also provides added functions that make it convenient to analyze your data!
But wait! Once you have finished analyzing the data in your table, or if all you wanted from the Format as Table feature was to add color to your table, you can always convert your data back to a regular table without the added data analysis features. Here’s how: Click in any cell within the table. Then from the Design tab, in the Tools group, click Convert to Range. You will be asked if you want to convert the table to a normal range. Click Yes, and your table, while retaining the colors, will lose all the added functionality.
- Rina B.
Comments
Post a Comment