Table in a Slide ... in PowerPoint!
As I have written in a previous blog, Table it! Inserting a Table in Word, there are numerous
benefits in using a table to display your data. Whether the data is in a Word document or in a
PowerPoint slide, displaying it in a table is a great way to organize your information.
Moreover, displaying your data in a table makes it much more accessible to your
audience. Say you are presenting key
financial information about your business to a group of investors. You have done
your research and have all the necessary data which clearly indicates that your
cookie shop is a thriving business. You can communicate this fact by putting
all the numerical data in a table format thus displaying your information to
its best advantage.
If you already have all your data in an Excel spreadsheet,
you can simply copy the table and paste it on to a PowerPoint slide. Then you
can format the table and make it look pretty.
Or, you can simply open your PowerPoint and then from the Ribbon click on the Insert tab and then click on Table. The Insert Table menu allows
you to choose the number of columns and rows you would like. This is very
similar to the way you would insert a table in a Word document.
There is, however, another way to insert a table in a
PowerPoint slide. After you open PowerPoint and insert a new slide, you will
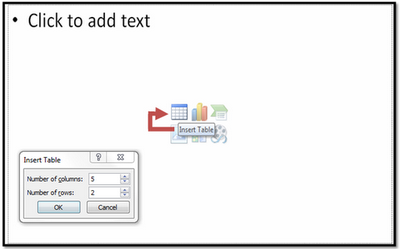
see six icons in the center of the slide. As you scroll over the icons, labels
appear indicating exactly what those icons are for. Clicking on the very first
icon, will bring up the Insert Table
dialog box from where you can choose the number of columns and rows you want. Once
you click OK, a table with the
desired number of rows and columns will be inserted on your slide.
Of course, the table inserted will contain the default
design in PowerPoint. But once you click on the table, you can change the look
and customize it, by using the tools in the Design and Layout tabs under
Table Tools. You can select the
design from the Table Styles menu or create your own theme
that displays your information in the most meaningful way.
A neat trick when using a table in PowerPoint is to let the data
in each row or column appear as you speak about it. So uncover the data in your
table selectively! Here's how: after you have included all the data in your
table, click on the Insert tab. From
the Illustrations group click on Shapes. Choose the rectangle shape and
draw it over the data you want to cover.
Now right-click
the rectangle, and choose Format Shape.
From the Format Shape dialog box,
under the Fill category, choose Slide background fill. Under Line Color category, make sure to
select No Line. Now there will be an
invisible shape covering your data.
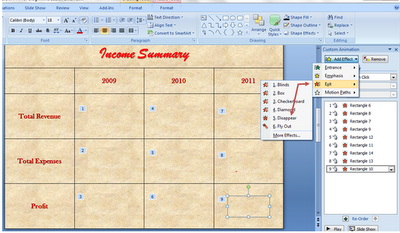
The next step is to animate this shape so that it will
appear only when you click. In order to animate it, click on the Animation tab, then click Custom Animation. From the Custom Animation panel, click on Add Effect, choose Exit and then click on More Effects.
From the Add Exit
Effect dialog box, under the Basic category, select Disappear.
Note: You can
copy and paste the rectangle over all the pieces of data that you want to
uncover selectively and then format and add animation to each one. Or, you can
finish formatting the first rectangle, including the animation, and then copy
and paste it over the desired data.
Now when you start your presentation and get to the slide
that contains your table, there will be blank spaces where you have covered
your data. But, as you click the data will appear. So the audience will focus
on the information that has just been uncovered rather than reading it all
ahead of time.
-Rina
B.


Comments
Post a Comment